Multi-Node Deployment
Deploy LLMBoost across multiple nodes in a Kubernetes cluster with automatic orchestration, load balancing, and monitoring. Scale your inference infrastructure to handle production workloads with enterprise-grade reliability.
Why Multi-Node Matters
Horizontal Scaling - Distribute models across multiple servers
High Availability - Eliminate single points of failure
Enterprise Ready - Built-in monitoring and management UIs
Automatic Orchestration - Kubernetes-native deployment with Helm

Prerequisites
Before deploying multi-node LLMBoost, ensure you have the following installed AND running:
- Kubernetes (1.32.0 or higher)
- CNI (Calico or Flannel)
- Helm (version 3.19 or higher https://helm.sh/docs/intro/install/)
- Latest CUDA and ROCm drivers for Nvidia and AMD GPUs, respectively
Required Tools
| Tool | Purpose | Verification |
|---|---|---|
| Kubernetes | Container orchestration | kubectl version |
| Helm | Package management | helm version |
| Docker | Container runtime | docker ps |
Verify Prerequisites
# Verify Kubernetes cluster is accessible
kubectl cluster-info # Should show: `Kubernetes control plane is running at https://<manager-node>:<port>'

# Verify Helm is installed
helm version # Should be v3.19 or higher

# Verify Docker is running
docker ps
docker --version # Should be 27.3 or higher

# Verify lbh is installed
lbh --version # Should be v0.3.0 or higher
Architecture Overview
LLMBoost multi-node deployment uses a Kubernetes-native architecture:
- Custom Resource Definitions (CRDs): Define model deployments declaratively
- Operator: Automatically reconciles desired state with actual deployment
- Load Balancing: Kubernetes Services distribute traffic across model replicas
- Monitoring: Built-in Grafana dashboards for metrics visualization
- Management UI: Headlamp-based interface for cluster administration
Usage Examples
- Using LLMBoost Hub
- Manual Setup (kubectl/helm)
Step 1: Install Cluster Infrastructure
All lbh cluster commands should be run on the control/manager node with access to the Kubernetes cluster. Please contact your cluster administrator if unsure.
Install the LLMBoost multi-node infrastructure using:
lbh cluster install
This command will:
- Create the
llmboostnamespace - Install the LLMBoost Operator via Helm chart
- Start the management and monitoring services
- If a cluster configuration file exists at
~/.llmboost_hub/cluster_config.json, it will also deploy the specified model deployments automatically.
After installation completes, you'll receive:
- Management UI Token: For accessing the Kubernetes dashboard
- Monitoring UI Credentials: Username and password for the Monitoring UI
After installing the helm chart using lbh cluster install, full unmasked credentials are displayed in the output. To see them again at any time, use lbh cluster --show-secrets.
Step 2: Configure Model Deployments
Create a cluster configuration file (e.g., cluster_config.json):
Basic functional example
Deploy one model on any node (node_replicas: 1 means LLMBoost will pick one available node):
{
  "schema_version": "1.0",
  "cluster": {
    "name": "production-cluster"
  },
  "model_deployments": [
    {
      "model": "meta-llama/Llama-3.1-8B-Instruct",
      "node_replicas": 1
    }
  ]
}
Advanced example template
{
  "schema_version": "1.0",
  "cluster": {
    "name": "production-cluster",
    "huggingfaceToken": "hf_xxx"
  },
  "model_deployments": [
    {
      "model": "meta-llama/Llama-3.1-8B-Instruct",
      "node_replicas": 3
    },
    {
      "model": "meta-llama/Llama-3.1-70B-Instruct",
      "resource_selector": [
        {"id": "k8s-node-1", "port": 8011},
        {"id": "k8s-node-2", "port": 8011}
      ]
    }
  ]
}
The above template uses example node IDs (k8s-node-1, k8s-node-2). Replace these with the actual node names or IDs in your Kubernetes cluster. You can retrieve node names using:
kubectl get nodes
Explanation of cluster_config.json
(Click to expand/collapse)
cluster_config.jsonConfiguration File Structure
The cluster_config.json file defines your multi-node deployment configuration. It consists of three main sections:
Top-Level Keys:
| Key | Type | Required | Description |
|---|---|---|---|
schema_version | String | Yes | Configuration schema version (currently "1.0") |
cluster | Object | Yes | Cluster-wide settings including name and authentication |
model_deployments | Array | Yes | List of model deployment configurations |
Cluster Settings (cluster object):
| Key | Type | Required | Description | Example |
|---|---|---|---|---|
name | String | Yes | Unique identifier for your cluster | "production-cluster" |
huggingfaceToken | String | No | Hugging Face API token for downloading private models | "hf_xxx..." |
Model Deployment Configuration (model_deployments array items):
| Key | Type | Required | Description | Example |
|---|---|---|---|---|
model | String | Yes | Full Hugging Face model name (org/model) | "meta-llama/Llama-3.1-8B-Instruct" |
docker_image | String | No | Custom Docker image (auto-detected if omitted) | "mangollm/mb-llmboost:latest" |
model_path | String | No | Custom path to model files inside container | "/workspace/custom/path" |
node_replicas | Integer | Either this OR resource_selector | Number of replicas to auto-distribute across nodes | 3 |
resource_selector | Array | Either this OR node_replicas | Explicit list of node assignments with ports | See below |
Resource Selector Options (resource_selector array items):
| Key | Type | Required | Default | Description | Example |
|---|---|---|---|---|---|
id | String | Yes | N/A | Kubernetes node name/identifier | "k8s-node-1" |
port | Integer | No | 8011 | Service port for this deployment | 8012 |
Deployment Strategies
Use node_replicas when:
- You want automatic distribution across available nodes
- Your cluster has homogeneous nodes (similar GPU/CPU specs)
- You don't need control over which specific nodes run the model
You cannot use both node_replicas and resource_selector in the same deployment. Choose one strategy per model.
{
  "model": "meta-llama/Llama-3.1-8B-Instruct",
  "node_replicas": 4  // LLMBoost automatically selects 4 nodes
}
Use resource_selector when:
- You need explicit control over node placement
- Different nodes have different capabilities or locations
- You want to assign different ports per node
- You're targeting specific hardware configurations
{
  "model": "meta-llama/Llama-3.1-70B-Instruct",
  "resource_selector": [
    {"id": "gpu-node-high-mem-1", "port": 8011},
    {"id": "gpu-node-high-mem-2", "port": 8011}
  ]
}
Step 3: Deploy Models
By default, lbh cluster install tries to automatically deploy the cluster configuration file at ~/.llmboost_hub/cluster_config.json during installation.
# Deploy with default config location: ~/.llmboost_hub/cluster_config.json
lbh cluster deploy
To disable the default deployment and deploy, use the -f flag to point to your configuration file.
lbh cluster deploy -f /path/to/cluster_config_1.json
This command will create the necessary Kubernetes deployment files (stored at ~/.llmboost_hub/model_deployments/) and apply them to your cluster.
Step 4: Verify Services are Ready
Before accessing the services, verify that they are ready to accept requests:
# Check if services are running on worker nodes
# Replace with your worker node IPs
curl <worker-node-ip>:30080/api/status

# Expected output:
# {"status":"running","server_name":"meta-llama/Llama-3.1-8B-Instruct"}
Step 5: Monitor Deployment Status
lbh cluster status
To view access credentials:
# Show masked credentials
lbh cluster status --show-secrets

# Show full unmasked credentials
lbh -v cluster status --show-secrets
Sample Output:
Models: 4/4             Mgmt.: 16/16

Pod                                    Status    Restarts  Message
-------------------------------------  --------  --------  -------
llama-3-1-8b-instruct-abc123           Running   0
llama-3-1-8b-instruct-def456           Running   0
llama-3-1-70b-instruct-node1-xyz789    Running   0
llama-3-1-70b-instruct-node2-mno345    Running   0

Service URLs:
Service               URL
--------------------  --------------------------
Monitoring (Grafana)  http://cluster-node:30082
Ingress Controller    http://cluster-node:30080
Step 6: View Logs
lbh cluster logs
Filter logs by category:
# View only model deployment logs
lbh cluster logs --models

# View management pod logs
lbh cluster logs --management
Filter logs by pod or pattern:
# Filter to specific pod
lbh cluster logs --pod llama-3-1-8b-instruct-abc123

# Show last 50 lines with error filtering
lbh cluster logs --models --tail 50 --grep ERROR
Step 7: Remove Deployments (Optional)
lbh cluster remove meta-llama/Llama-3.1-8B-Instruct
Remove all deployments:
# With confirmation prompt
lbh cluster remove --all

# Skip confirmation
lbh cluster remove --all --force
Step 8: Uninstall Infrastructure (Optional)
lbh cluster uninstall
Skip confirmation prompt:
lbh cluster uninstall --force
The namespace llmboost is not automatically deleted. To completely remove:
kubectl delete namespace llmboost
Step 1: Install Helm Chart
Add and update Helm repository:
helm repo add llmboost https://mangoboost.github.io/llmboost-helm
helm repo update
Verify chart availability:
helm search repo llmboost
Install the chart:
helm install llmboost llmboost/llmboost \
  -n llmboost \
  -f values.yaml
Step 2: Retrieve Access Credentials
Management UI Token (Headlamp):
kubectl get secret -n llmboost headlamp-admin-token \
  -o jsonpath='{.data.token}' | base64 -d
Monitoring Username (Grafana):
kubectl get secret -n llmboost grafana-admin-secret \
  -o jsonpath='{.data.admin-user}' | base64 -d
Monitoring Password (Grafana):
kubectl get secret -n llmboost grafana-admin-secret \
  -o jsonpath='{.data.admin-password}' | base64 -d
Step 3: Create Model Deployment Manifest
Create a file llama-deployment.yaml:
apiVersion: mangoboost.io/v1
kind: LLMBoostDeployment
metadata:
  name: llama-3-1-8b-instruct
  namespace: llmboost
spec:
  # The URL prefix for OpenAI API endpoint
  apiEndpoint: /api
  deployments:
    # The deployment name can be customized by the user
    amd-deployment:
      gpu:
        # Deploy on the machines with AMD GPUs
        type: amd
        # Or, deploy on the machines with Nvidia GPUs
        # type: nvidia
      # Your Huggingface token (optional)
      huggingfaceToken: hf_xxxx
      # Use "mangollm/mb-llmboost-nvidia:latest" for Nvidia deployments
      image: mangollm/mb-llmboost-rocm:latest
      # Currently, only "serve" is supported"
      mode: serve
      # Model name from the Huggingface repository
      modelName: meta-llama/Llama-3.1-8B-Instruct
      # Optionally, specify the name of the Kubernetes node(s), on which the pods will be deployed
      # Otherwise, the pods will be deployed on all nodes that have the matching GPU
      # nodes:
      # - node-1
      # - node-2

    # Multiple heterogeneous deployments can be specified - load balancer will tie them under the single endpoint
    # nvidia-deployment:
    #  gpu:
    #    type: nvidia
    #  ...
Step 4: Deploy Model
kubectl apply -f llama-deployment.yaml
Verify deployment:
# Check deployment resource
kubectl get llmboostdeployments -n llmboost

# Check pods
kubectl get pods -n llmboost -l llmboost/deployment-group-name=llama-3-1-8b-instruct
Step 5: Check Deployment Status
List all deployments:
kubectl get llmboostdeployments -n llmboost
View deployment details:
kubectl describe llmboostdeployment llama-3-1-8b-instruct -n llmboost
Check pod status:
kubectl get pods -n llmboost
View pod logs:
kubectl logs -n llmboost <pod-name> --all-containers=true
Step 6: Test the API Endpoint
Query the API endpoint for status
curl http://<worker node IP>:30080/api/status

# After successful deployment, the endpoint should return the following response
{"status":"running","server_name":"meta-llama/Llama-3.1-8B-Instruct"}
Note the
/apiprefix in the URL which was specified in thespec.apiEndpointfield of the manifest
Step 7: Remove Deployment
Delete specific deployment:
kubectl delete llmboostdeployment llama-3-1-8b-instruct -n llmboost
Delete all deployments:
kubectl delete llmboostdeployments --all -n llmboost
Step 8: Uninstall Helm Chart
Delete the existing llmboostdeployments
kubectl get llmboostdeployments -n llmboost
kubectl delete llmboostdeployments <deployment 1> <deployment 2> ...
Uninstall the LLMBoost Helm chart
helm uninstall llmboost -n llmboost
Remove namespace (optional):
kubectl delete namespace llmboost
Configuration Parameters
Cluster Configuration
| Field | Description | Required |
|---|---|---|
schema_version | Configuration schema version | Yes |
cluster.name | Cluster identifier | Yes |
cluster.huggingfaceToken | HF token for private models | No |
Model Deployment Configuration
| Field | Description | Required |
|---|---|---|
model | Hugging Face model name | Yes |
docker_image | Custom Docker image | No (auto-detected) |
model_path | Custom model path in container | No |
node_replicas | Number of replicas (auto-distributed) | Either this or resource_selector |
resource_selector | Explicit node assignments | Either this or node_replicas |
Resource Selector Options
| Field | Description | Default |
|---|---|---|
id | Node identifier | Required |
port | Service port | 8011 |
Environment Variables
Configure LLMBoost Hub cluster operations:
| Variable | Default | Description |
|---|---|---|
LBH_CLUSTER_CONFIG_PATH | $LBH_HOME/cluster_config.json | Default cluster config file |
LBH_KUBE_MODEL_DEPLOYMENTS_PATH | $LBH_HOME/k8s/deployments/ | Generated manifests directory |
KUBECONFIG | ~/.kube/config | Kubernetes config file |
Monitoring and Management
Access Management UI (Headlamp)
The management UI is served from port 30080 of the control/manager node under the URL path /manage/.
Access Steps:
- Get the Management UI URL from
lbh cluster status - Navigate to
http://<manager-node-ip>:30080/manage/in your browser- Use
localhost:30080/manage/if accessing from the manager node - Note: The trailing
/is required
- Use
- On first access, you'll be prompted for a login token
- Enter the token displayed during
lbh cluster installor retrieve it with:lbh cluster status --show-secrets
# Or get it directly from Kubernetes
kubectl get secret -n llmboost headlamp-admin-token \
-o jsonpath='{.data.token}' | base64 -d - After successful login, you'll access the cluster management interface
Key Views and Capabilities:
Map View
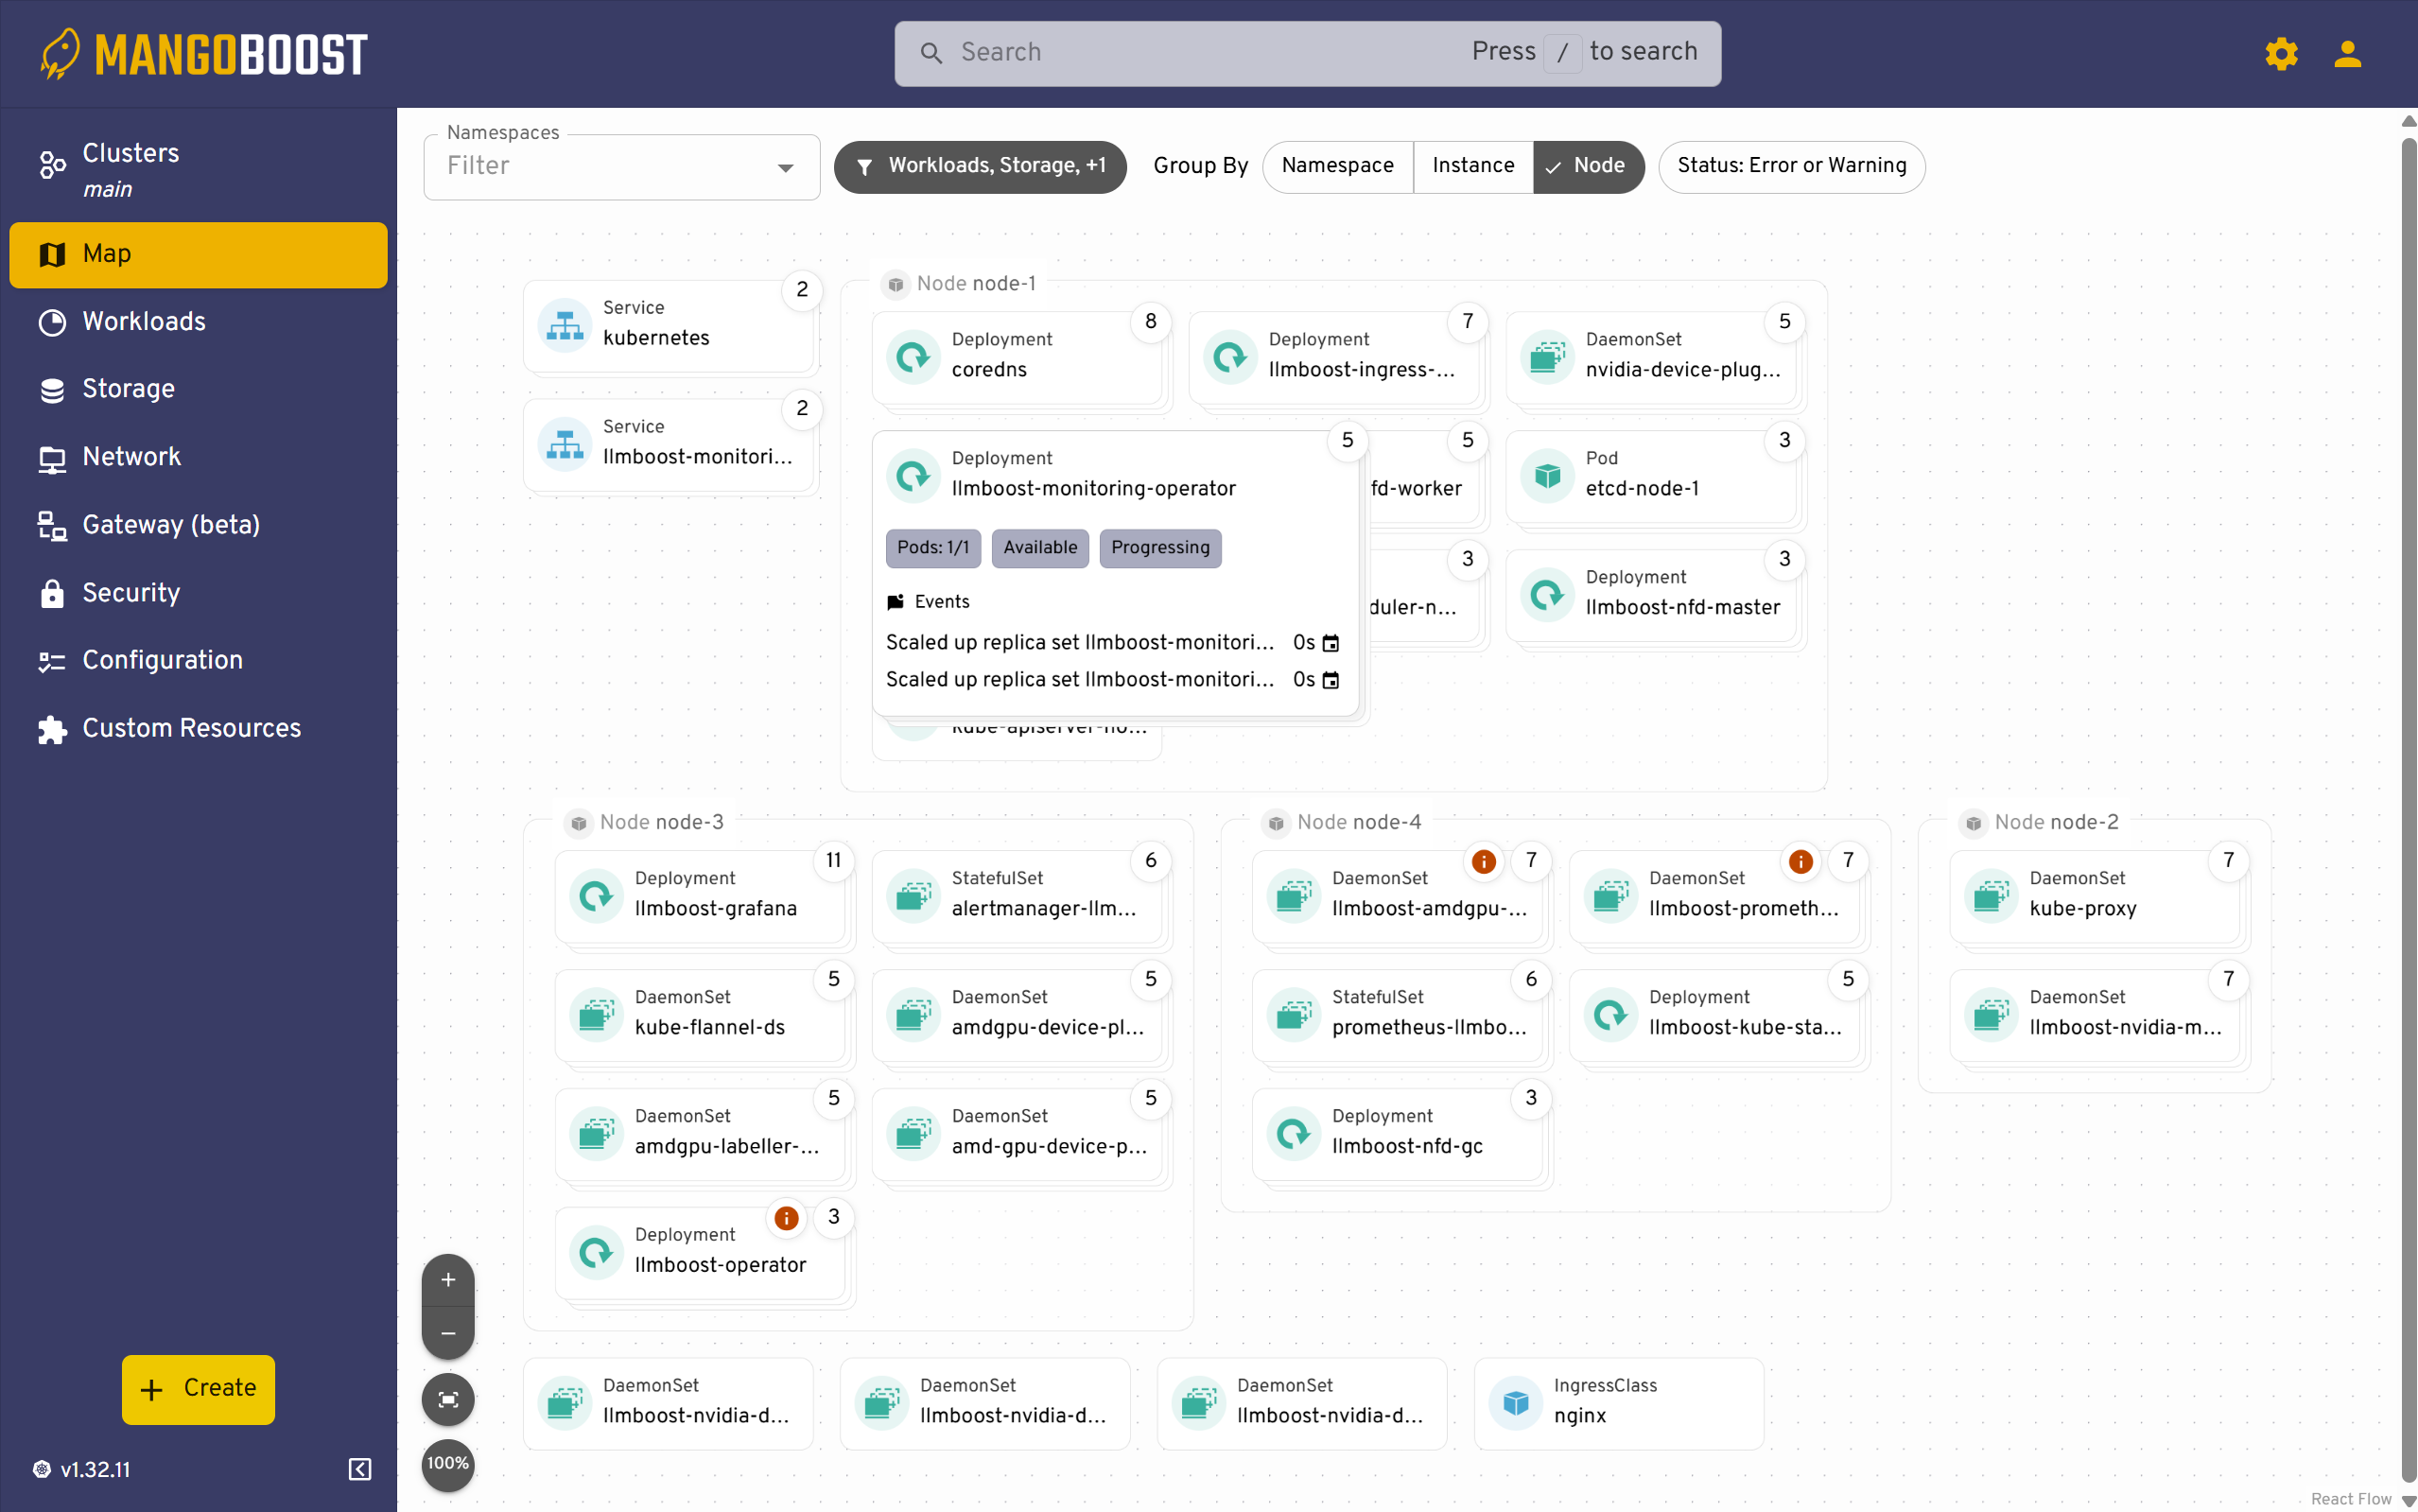
The Map view provides a visual topology of your cluster, displaying how deployments and workloads are distributed across nodes. This view helps you quickly identify resource allocation patterns and spot nodes with heavy workloads or potential bottlenecks. Each node shows the number of running pods and deployments, making it easy to assess cluster balance at a glance.
Namespace Overview
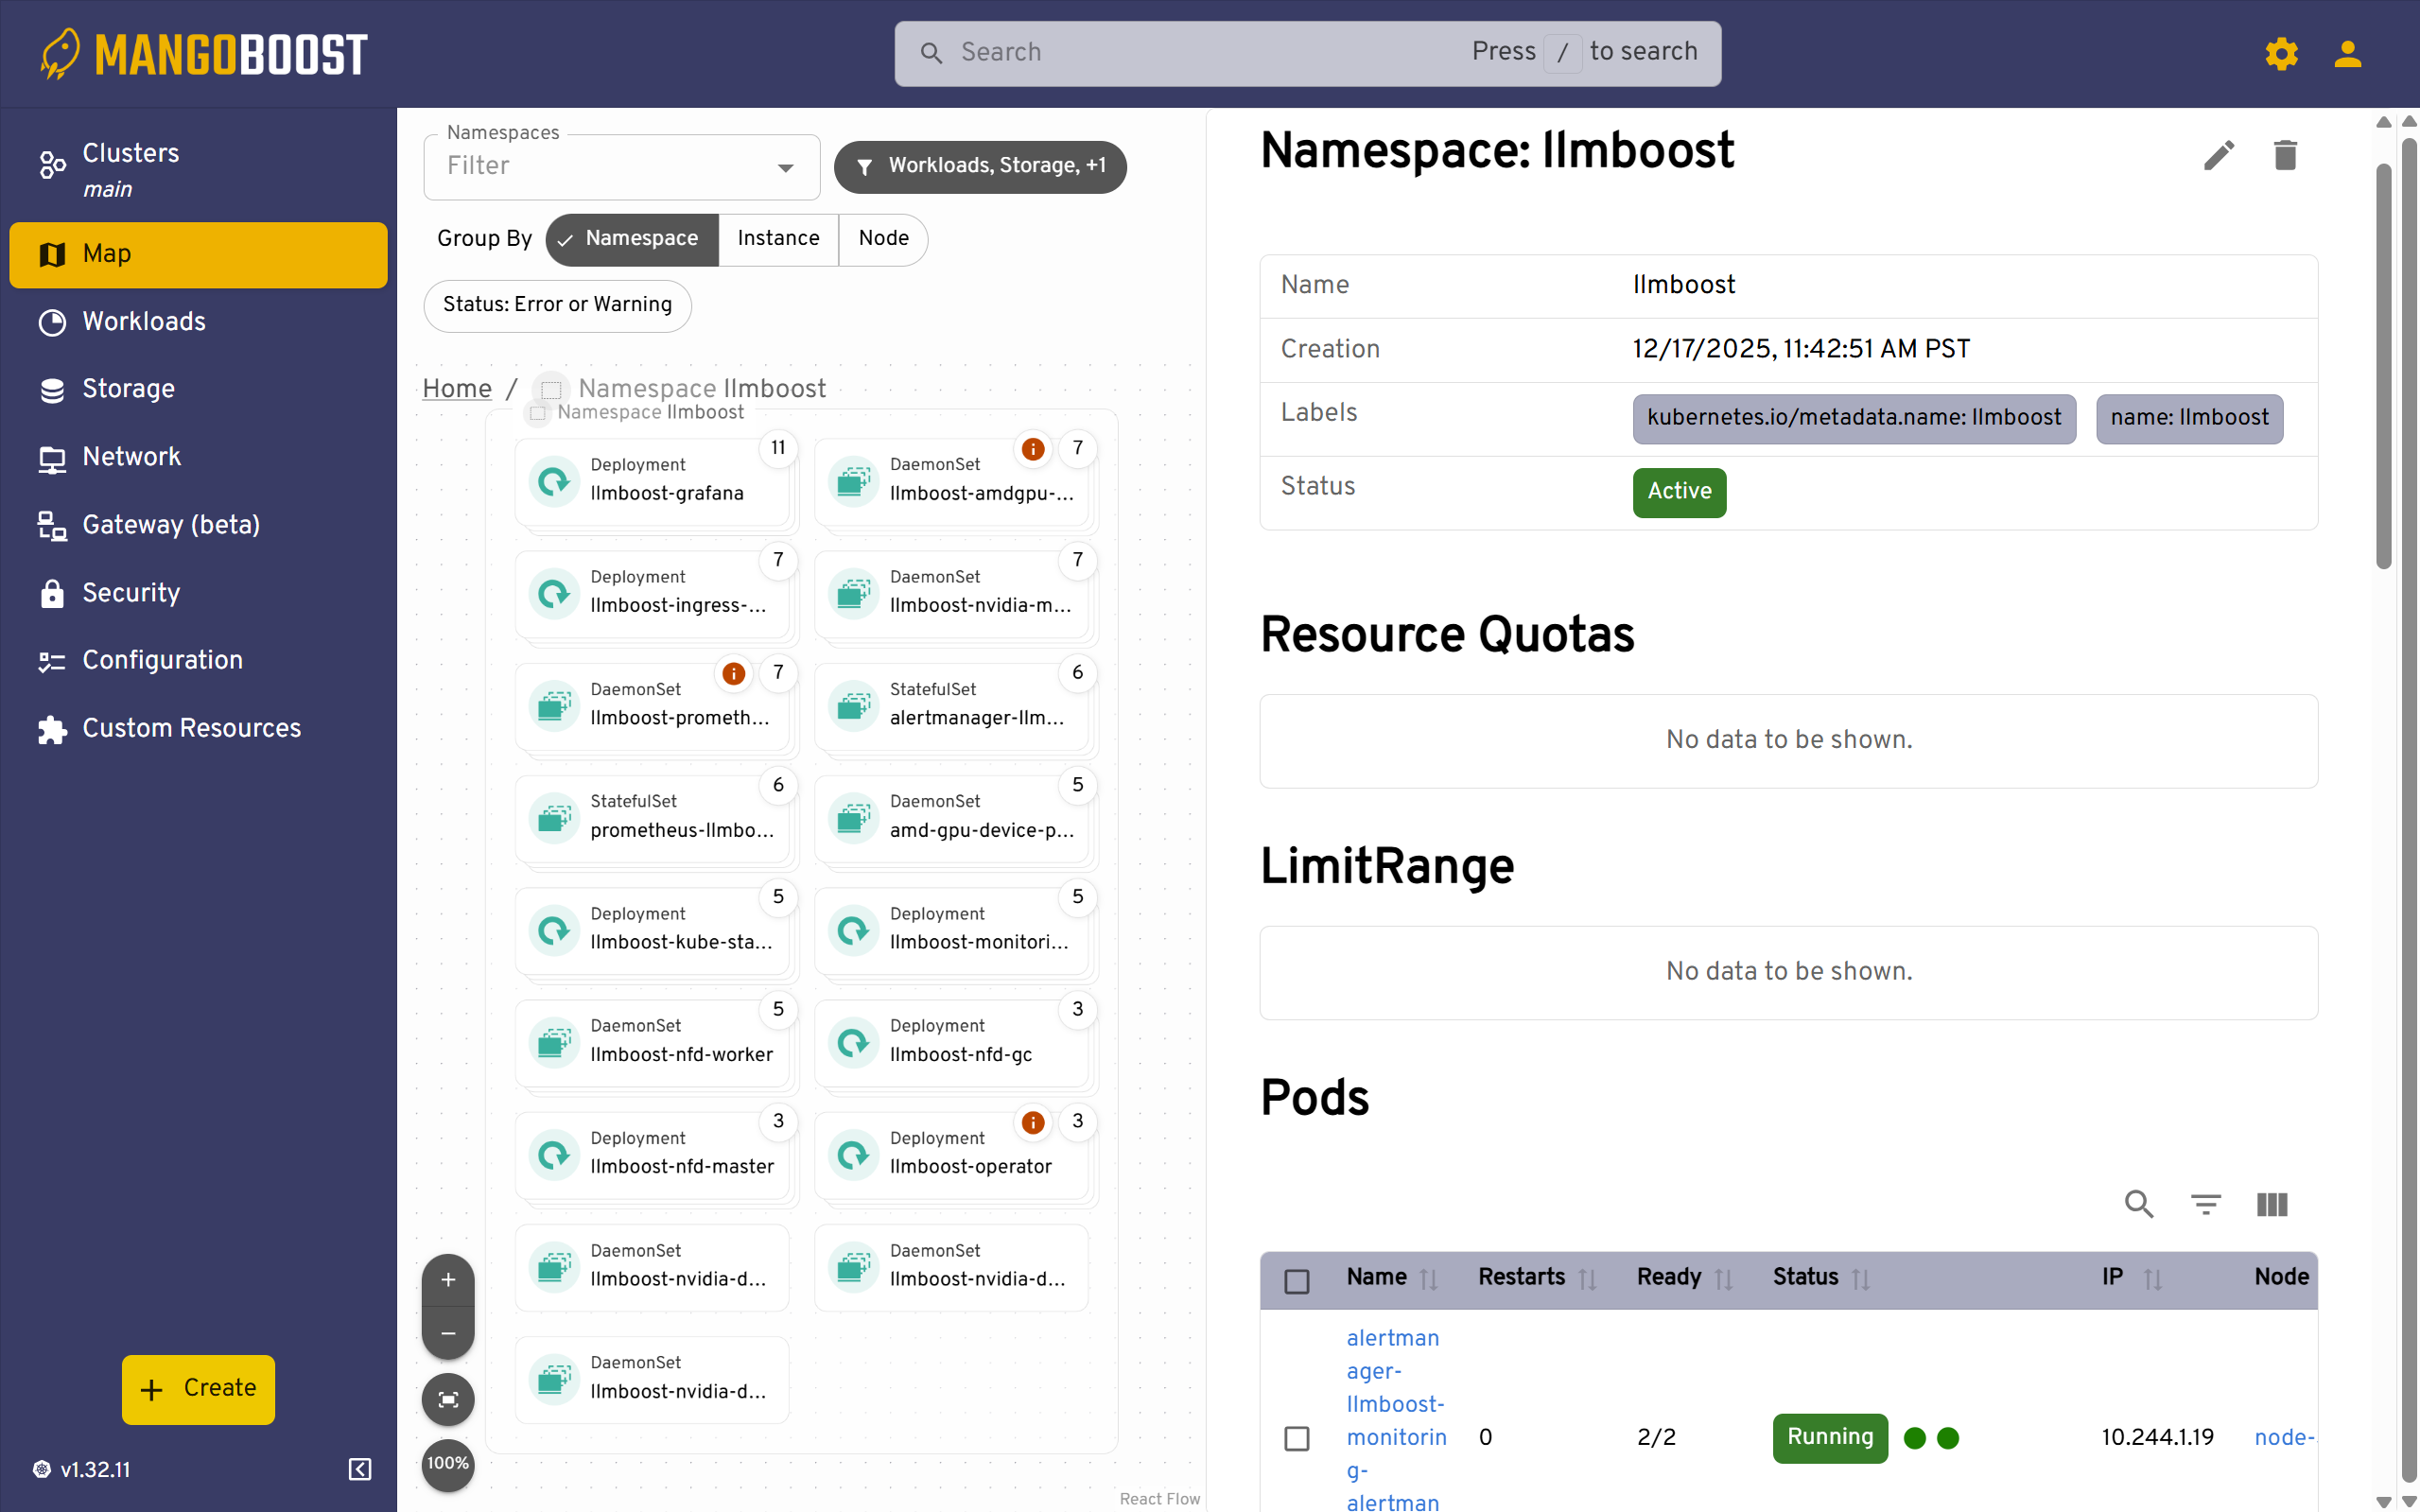
The namespace view displays all resources within the llmboost namespace, including deployments, DaemonSets, StatefulSets, and pods. This centralized view allows you to monitor resource counts, check pod readiness status, and quickly identify any failed or pending resources. Use this screen to verify that all components of your LLMBoost deployment are running as expected.
Nodes List
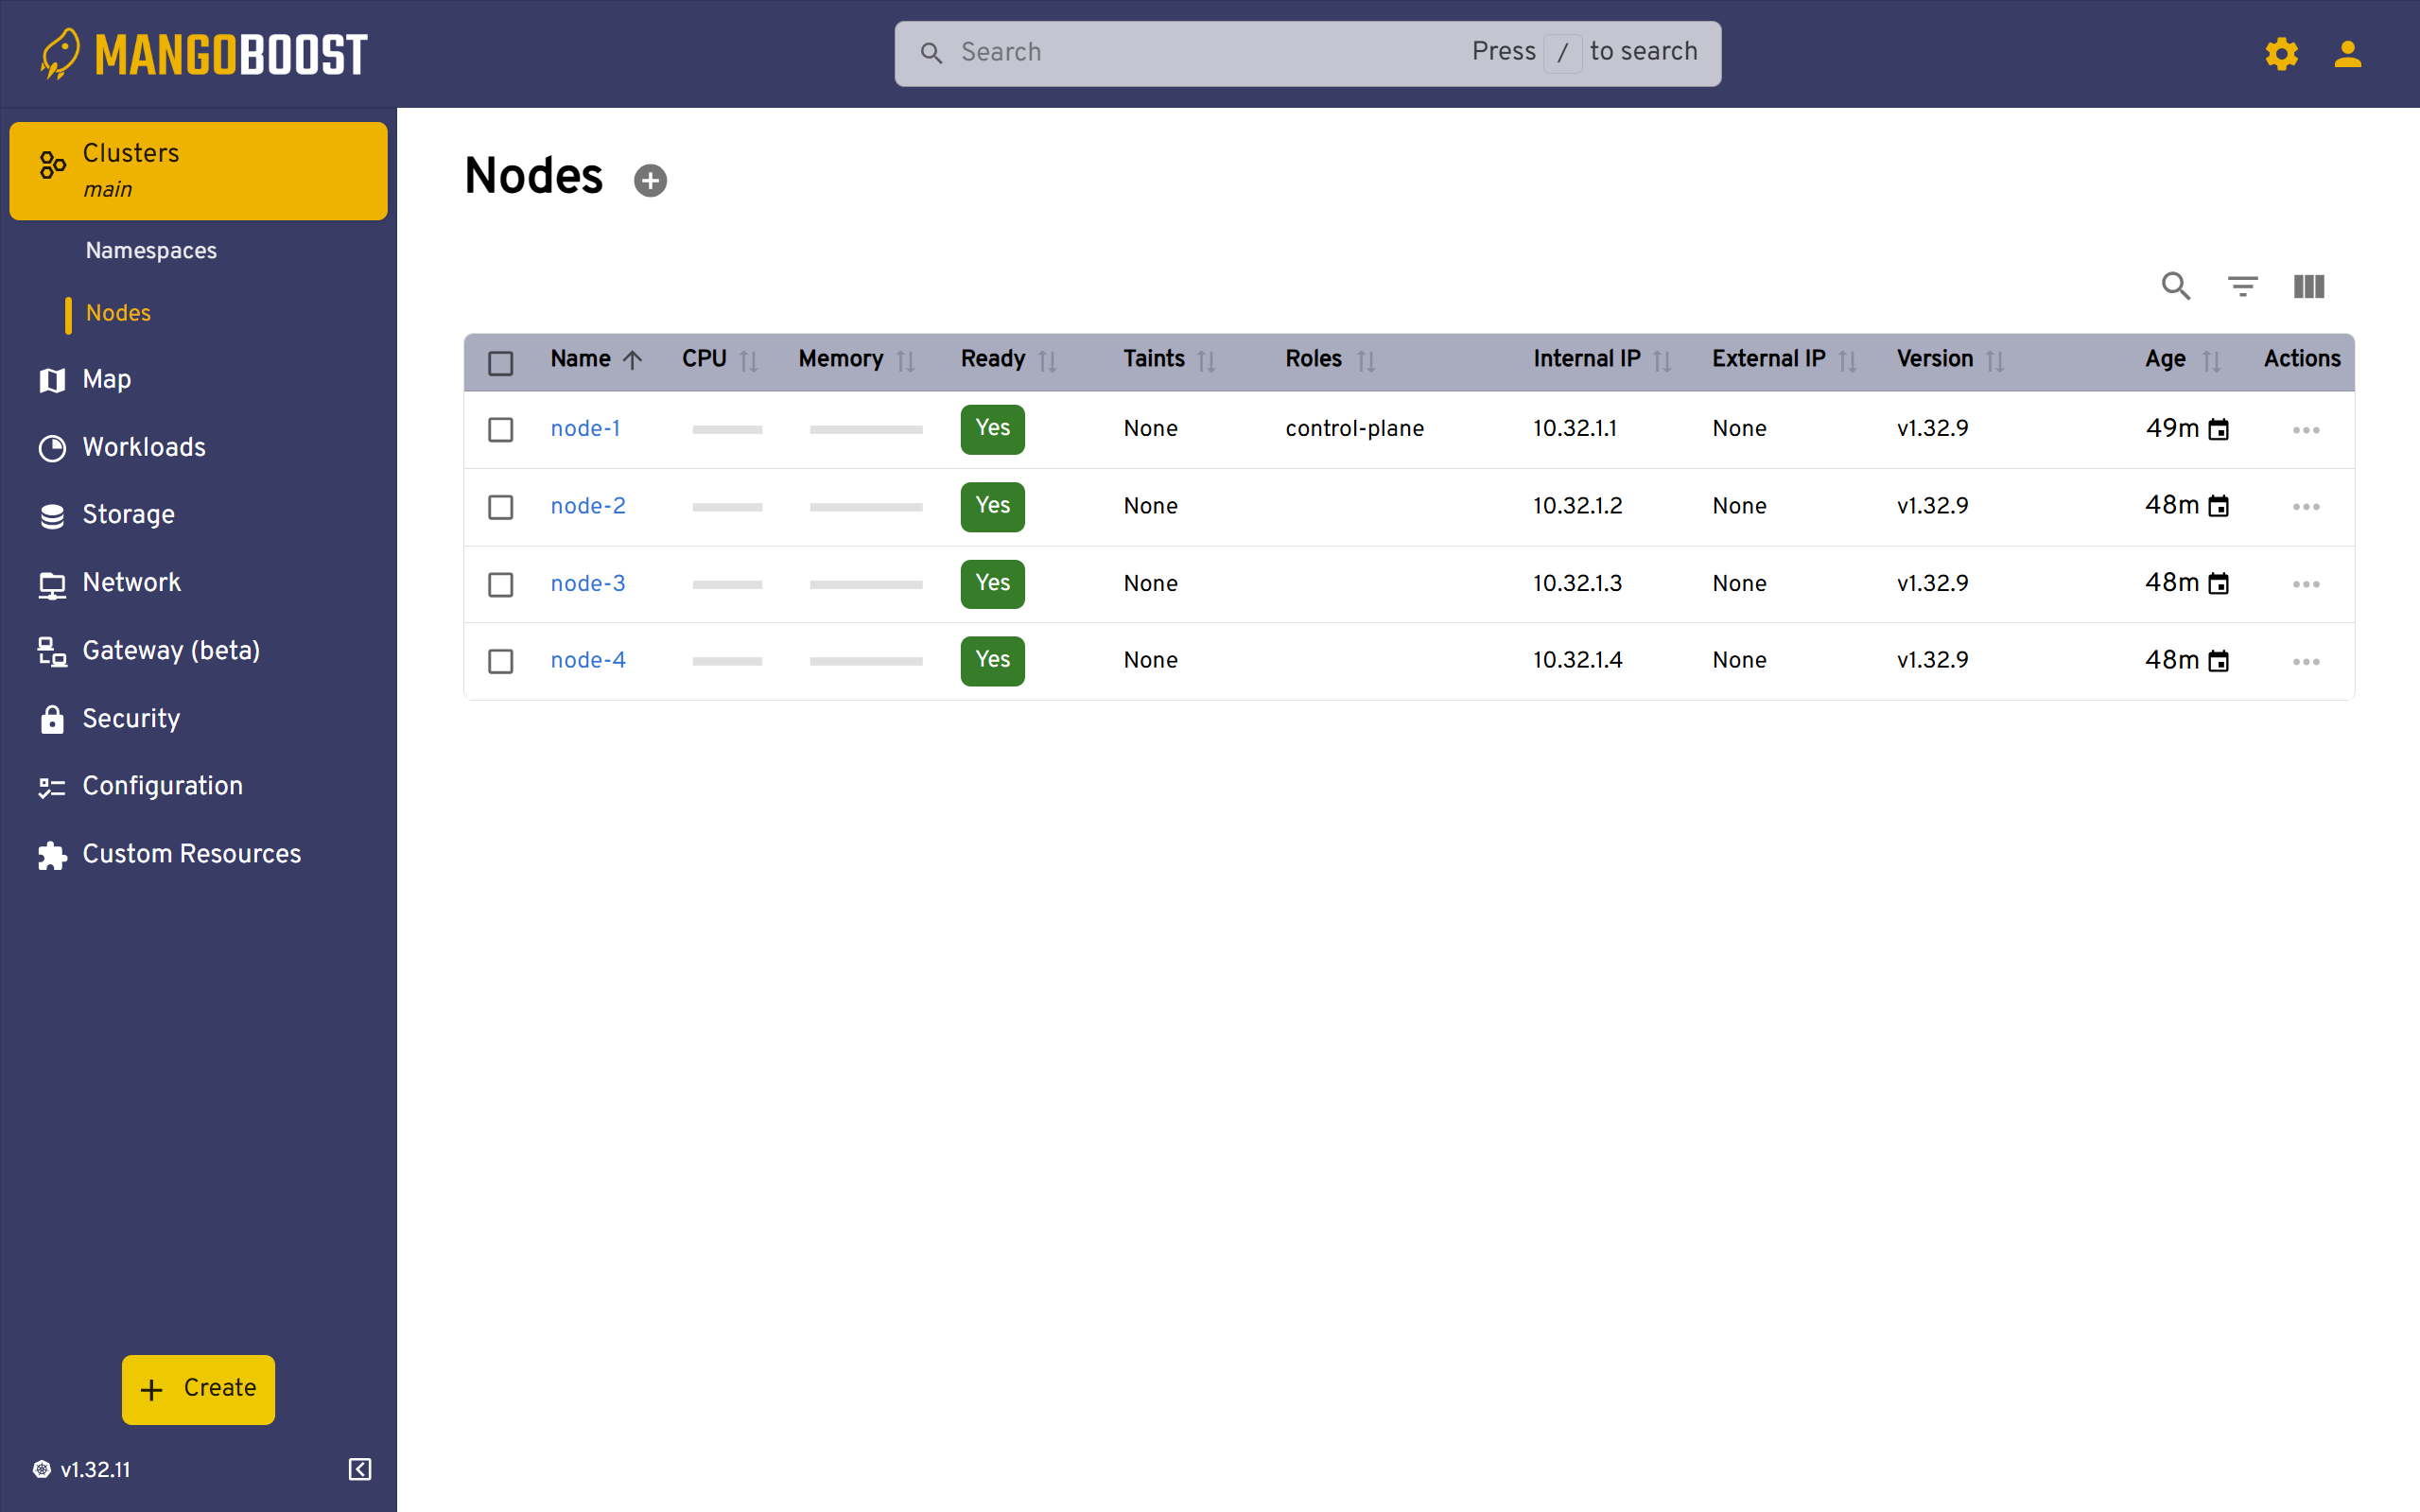
The Nodes view shows all Kubernetes nodes in your cluster with their health status, roles, IP addresses, and versions. This screen is essential for verifying node availability and identifying which nodes are ready to accept workloads. You can quickly see the age of each node and access detailed information about CPU, memory, and other resource capacities.
Cluster Overview
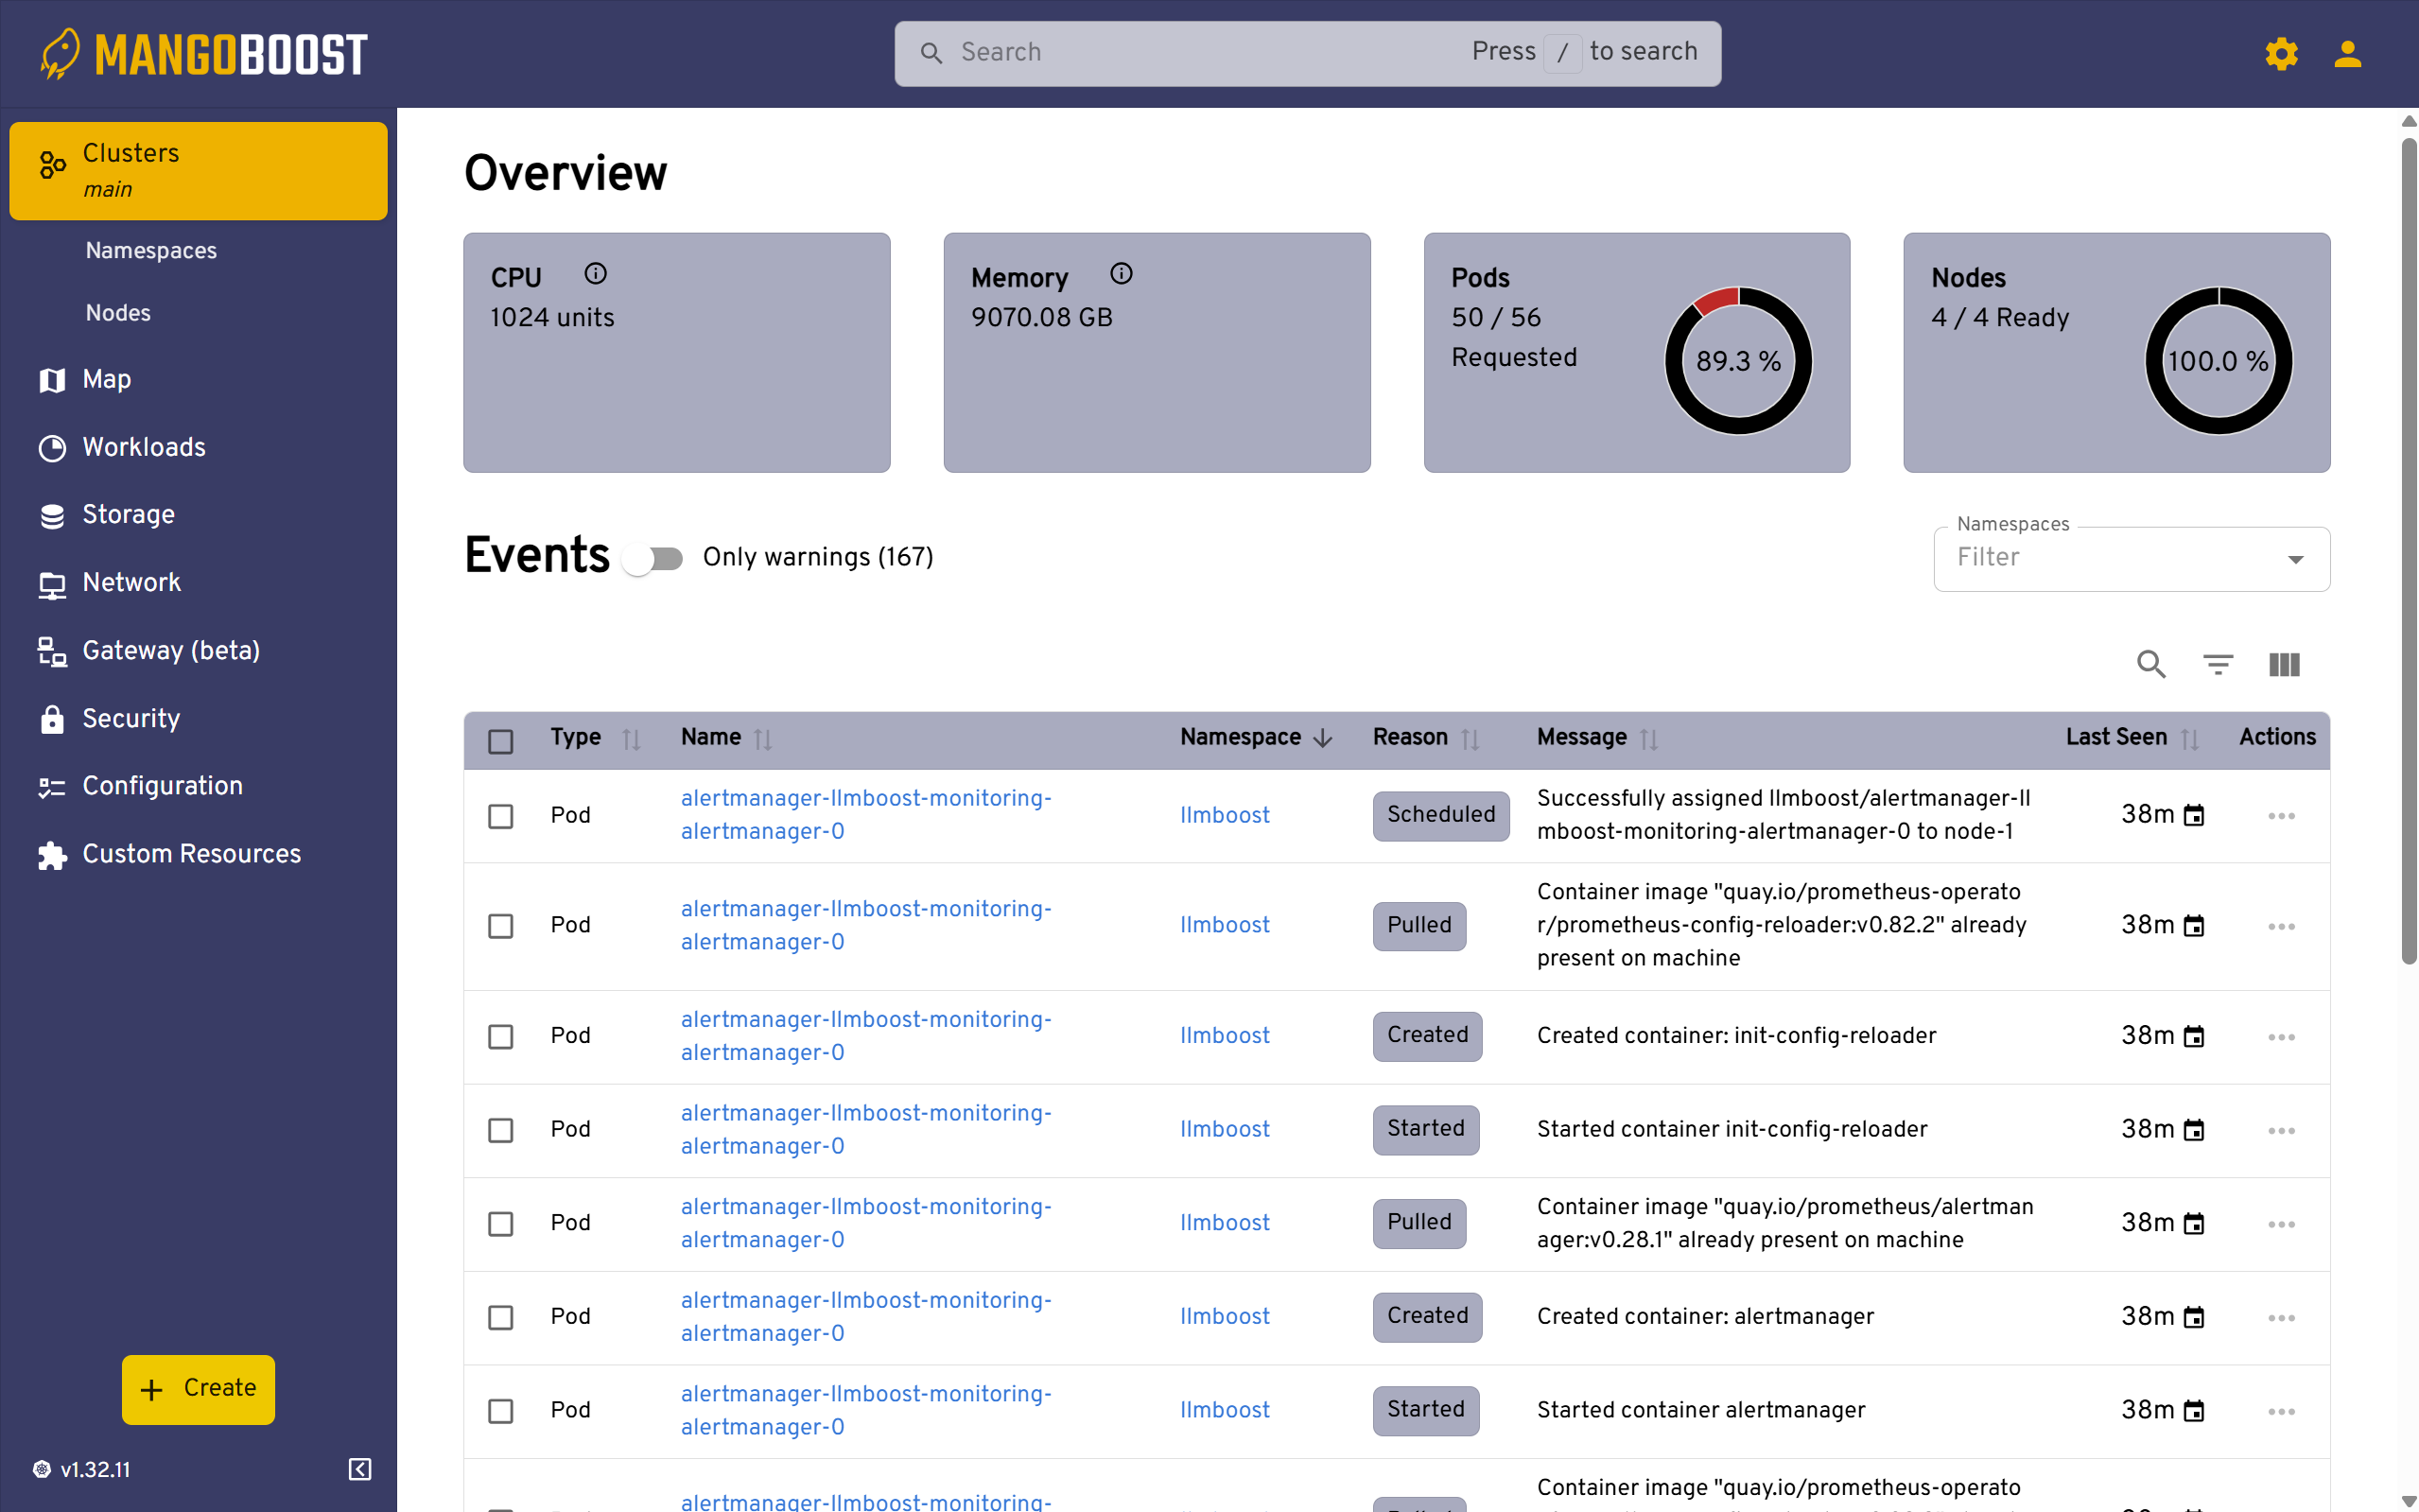
The Overview page provides high-level cluster health metrics including total CPU units, memory capacity, pod counts, and node readiness statistics. The Events section displays recent Kubernetes events with timestamps, helping you troubleshoot deployments by showing pod scheduling, container creation, and image pulling activities. This is your first stop when diagnosing deployment issues or tracking recent changes.
Pods Management
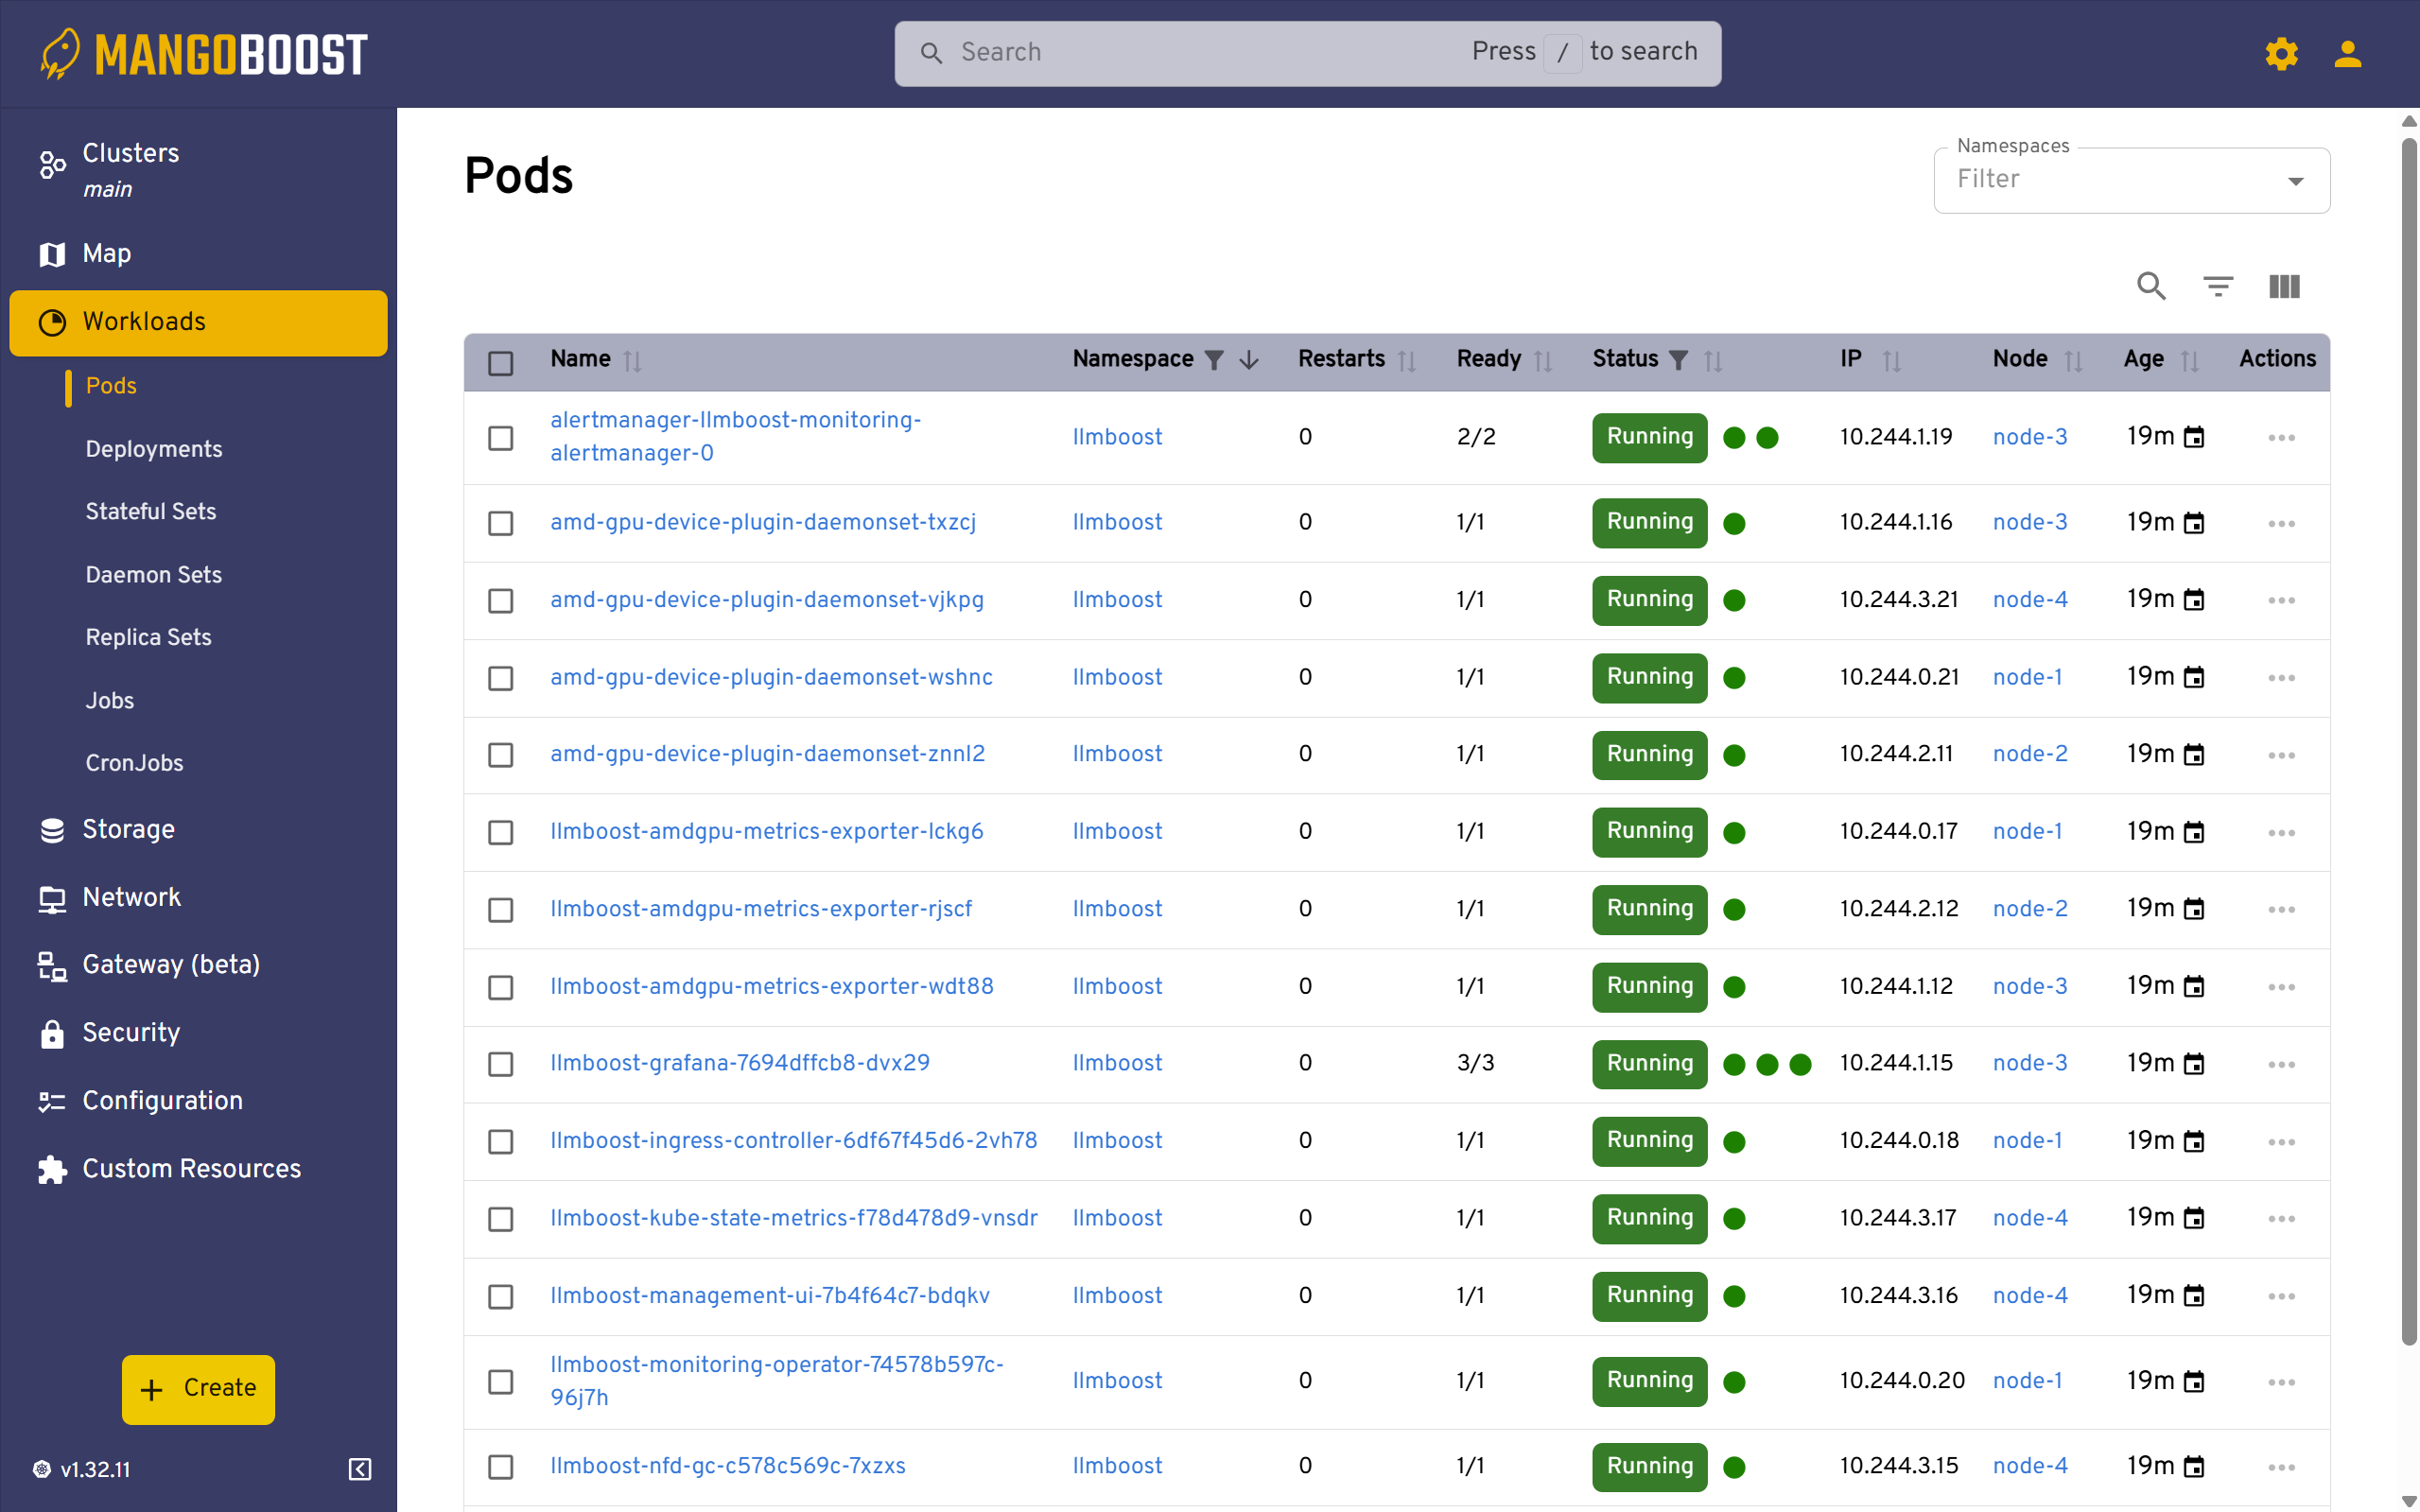
The Pods view lists all running pods across your cluster with their namespace, restart counts, readiness status, IP addresses, and assigned nodes. This detailed view allows you to monitor individual pod health, identify pods that are restarting frequently, and access pod logs for debugging. Use this screen to track which nodes are hosting specific model deployments and verify that pods are distributed as intended.
Access Monitoring Dashboard (Grafana)
The monitoring UI is accessible at port 30080 under the path /monitor/ of the control/manager node.
Access Steps:
- Get the Monitoring URL from
lbh cluster status - Navigate to
http://<manager-node-ip>:30080/monitor/in your browser- Note: The trailing
/is required
- Note: The trailing
- Login with credentials from:
lbh cluster status --show-secrets
# Or retrieve directly
kubectl get secret -n llmboost grafana-admin-secret \
  -o jsonpath='{.data.admin-user}' | base64 -d
kubectl get secret -n llmboost grafana-admin-secret \
  -o jsonpath='{.data.admin-password}' | base64 -d
LLMBoost-Specific Metrics:
LLMBoost exposes the following metrics for each node:
| Metric | Description |
|---|---|
num_active_requests | Number of ongoing chat/completion requests in the node |
num_total_requests_total | Total number of requests served by the LLMBoost engine |
GPU Metrics:
Platform-specific GPU metrics are also available:
-
NVIDIA (DCGM)
-
AMD (Device Metrics Exporter)
Available Dashboards:
GPU and CPU Metrics Dashboard
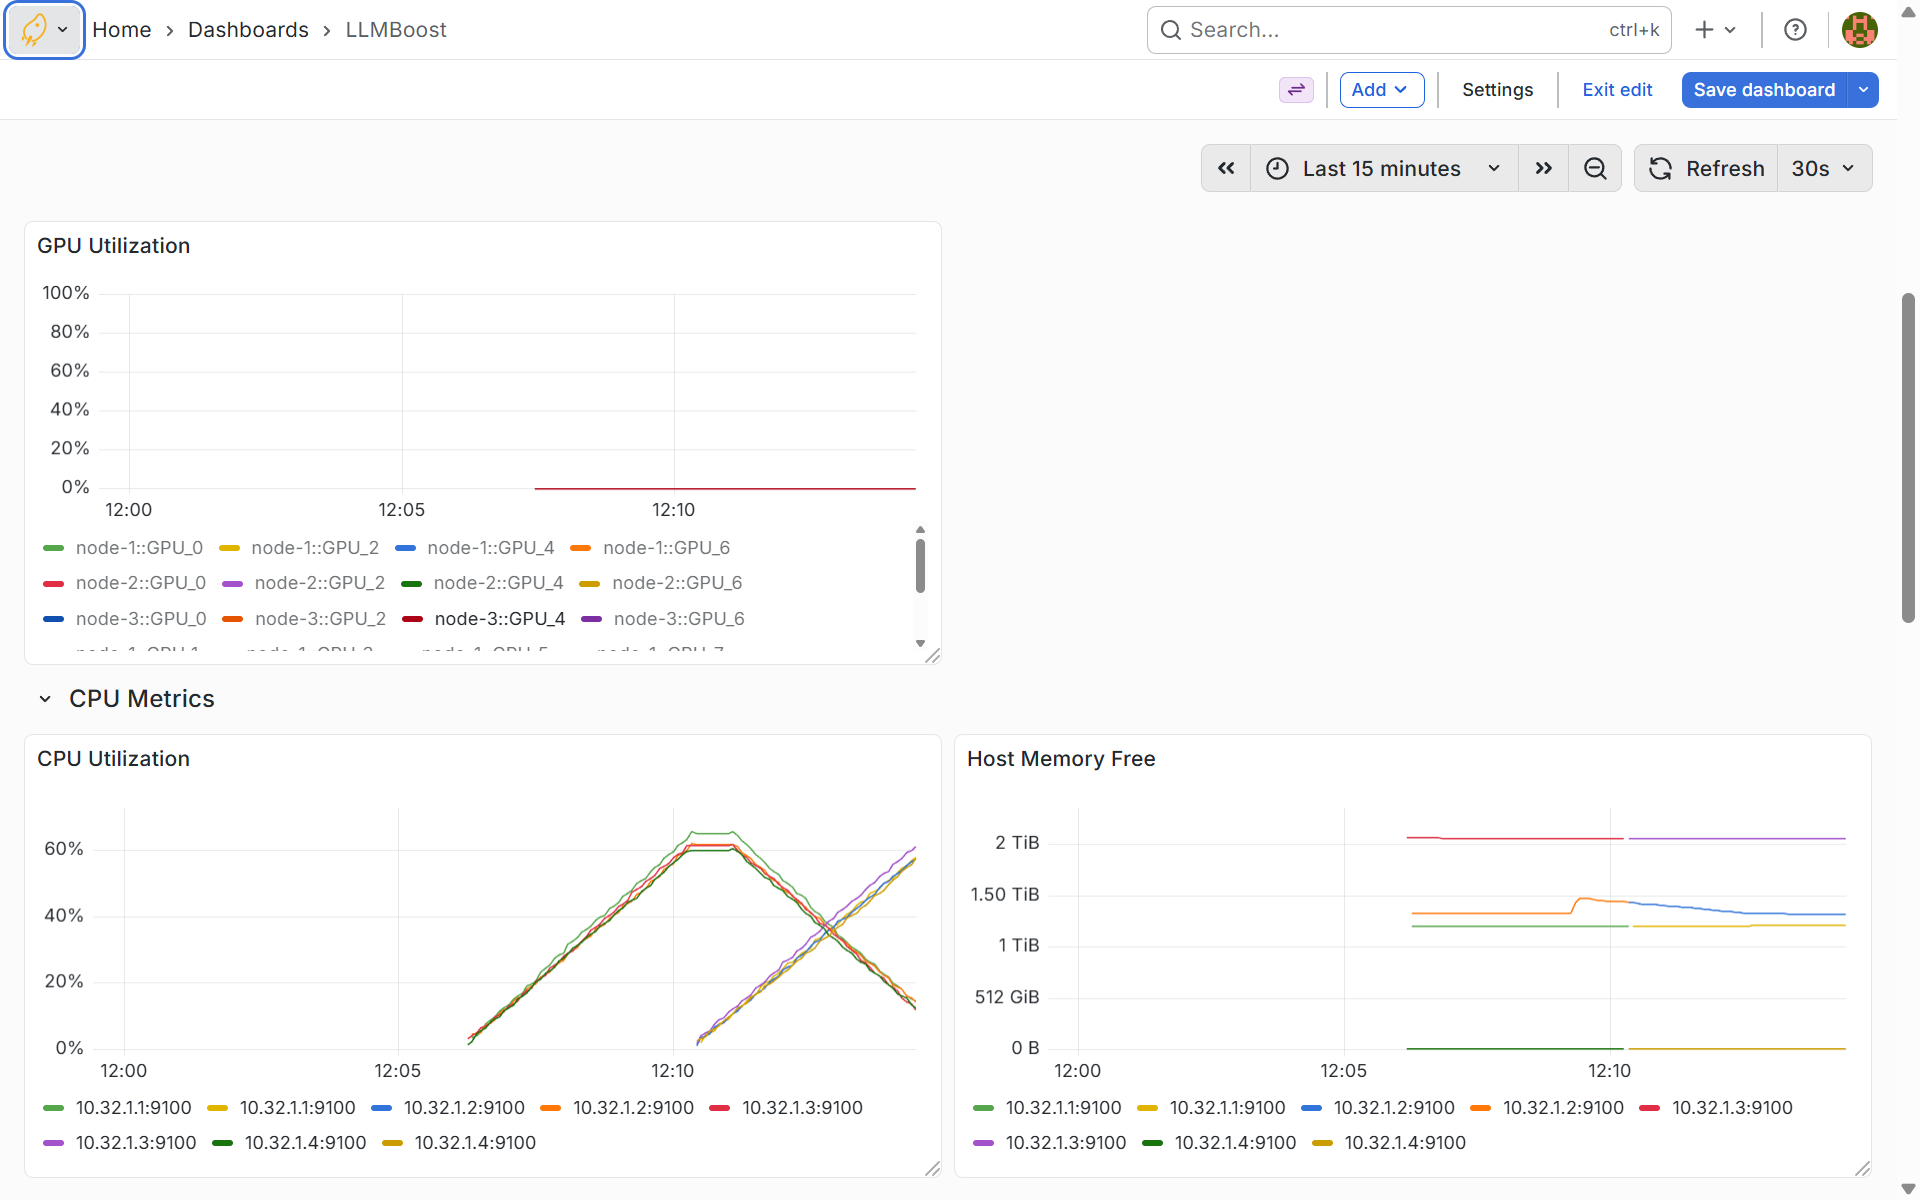
This dashboard tracks real-time GPU utilization across all GPUs in your cluster, with separate time-series graphs for each GPU on each node. The CPU metrics section displays utilization and memory consumption per node, helping you identify compute bottlenecks and optimize resource allocation. Use these graphs to ensure GPUs are being fully utilized during inference and to detect idle resources that could handle additional workloads.
Detailed GPU Metrics
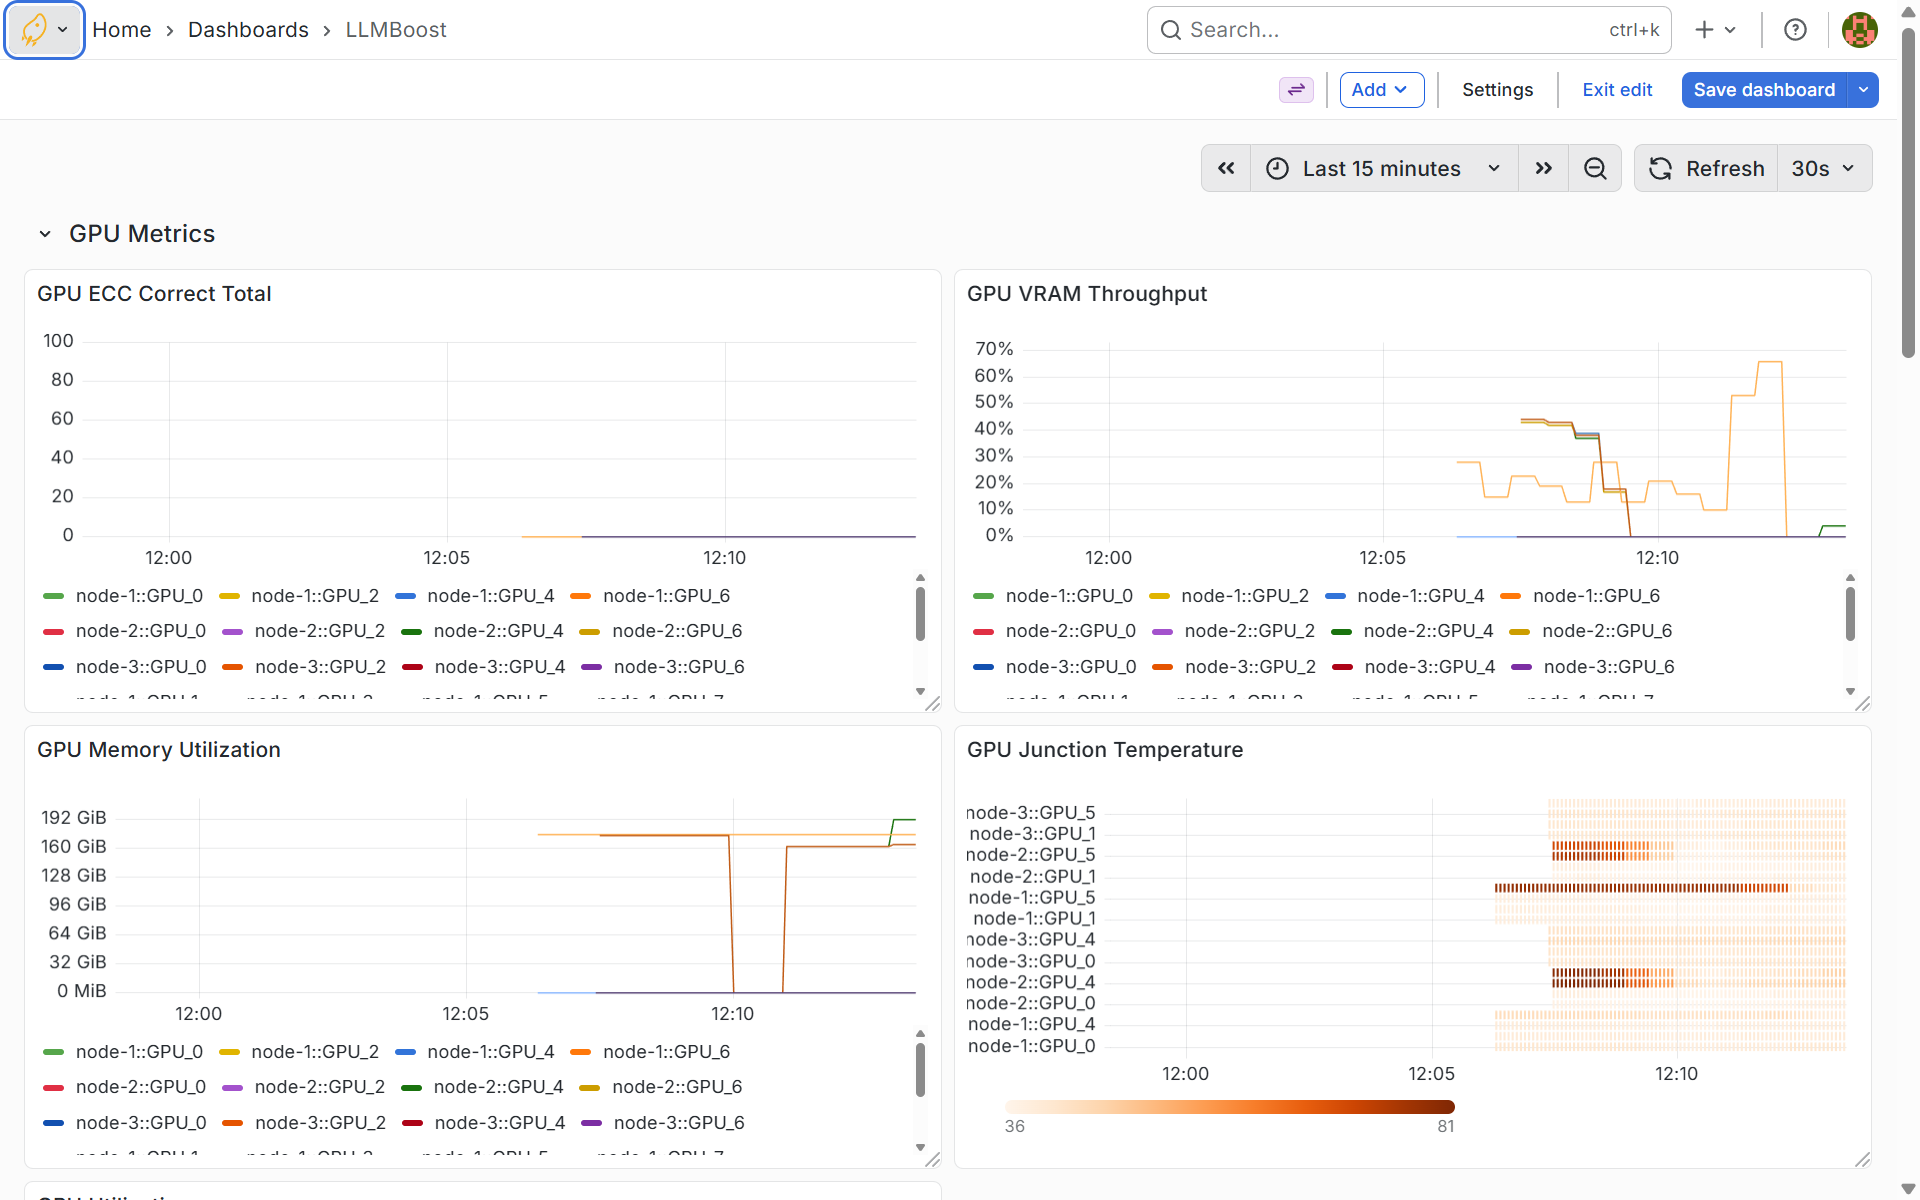
The detailed GPU metrics dashboard provides hardware-level insights including ECC (Error-Correcting Code) errors, VRAM throughput, memory utilization per GPU, and junction temperatures. These metrics are critical for identifying hardware issues, thermal throttling, or memory saturation that could impact inference performance. Monitor temperature trends to ensure cooling systems are adequate and watch VRAM utilization to verify models fit comfortably within available GPU memory.
Network Performance Metrics
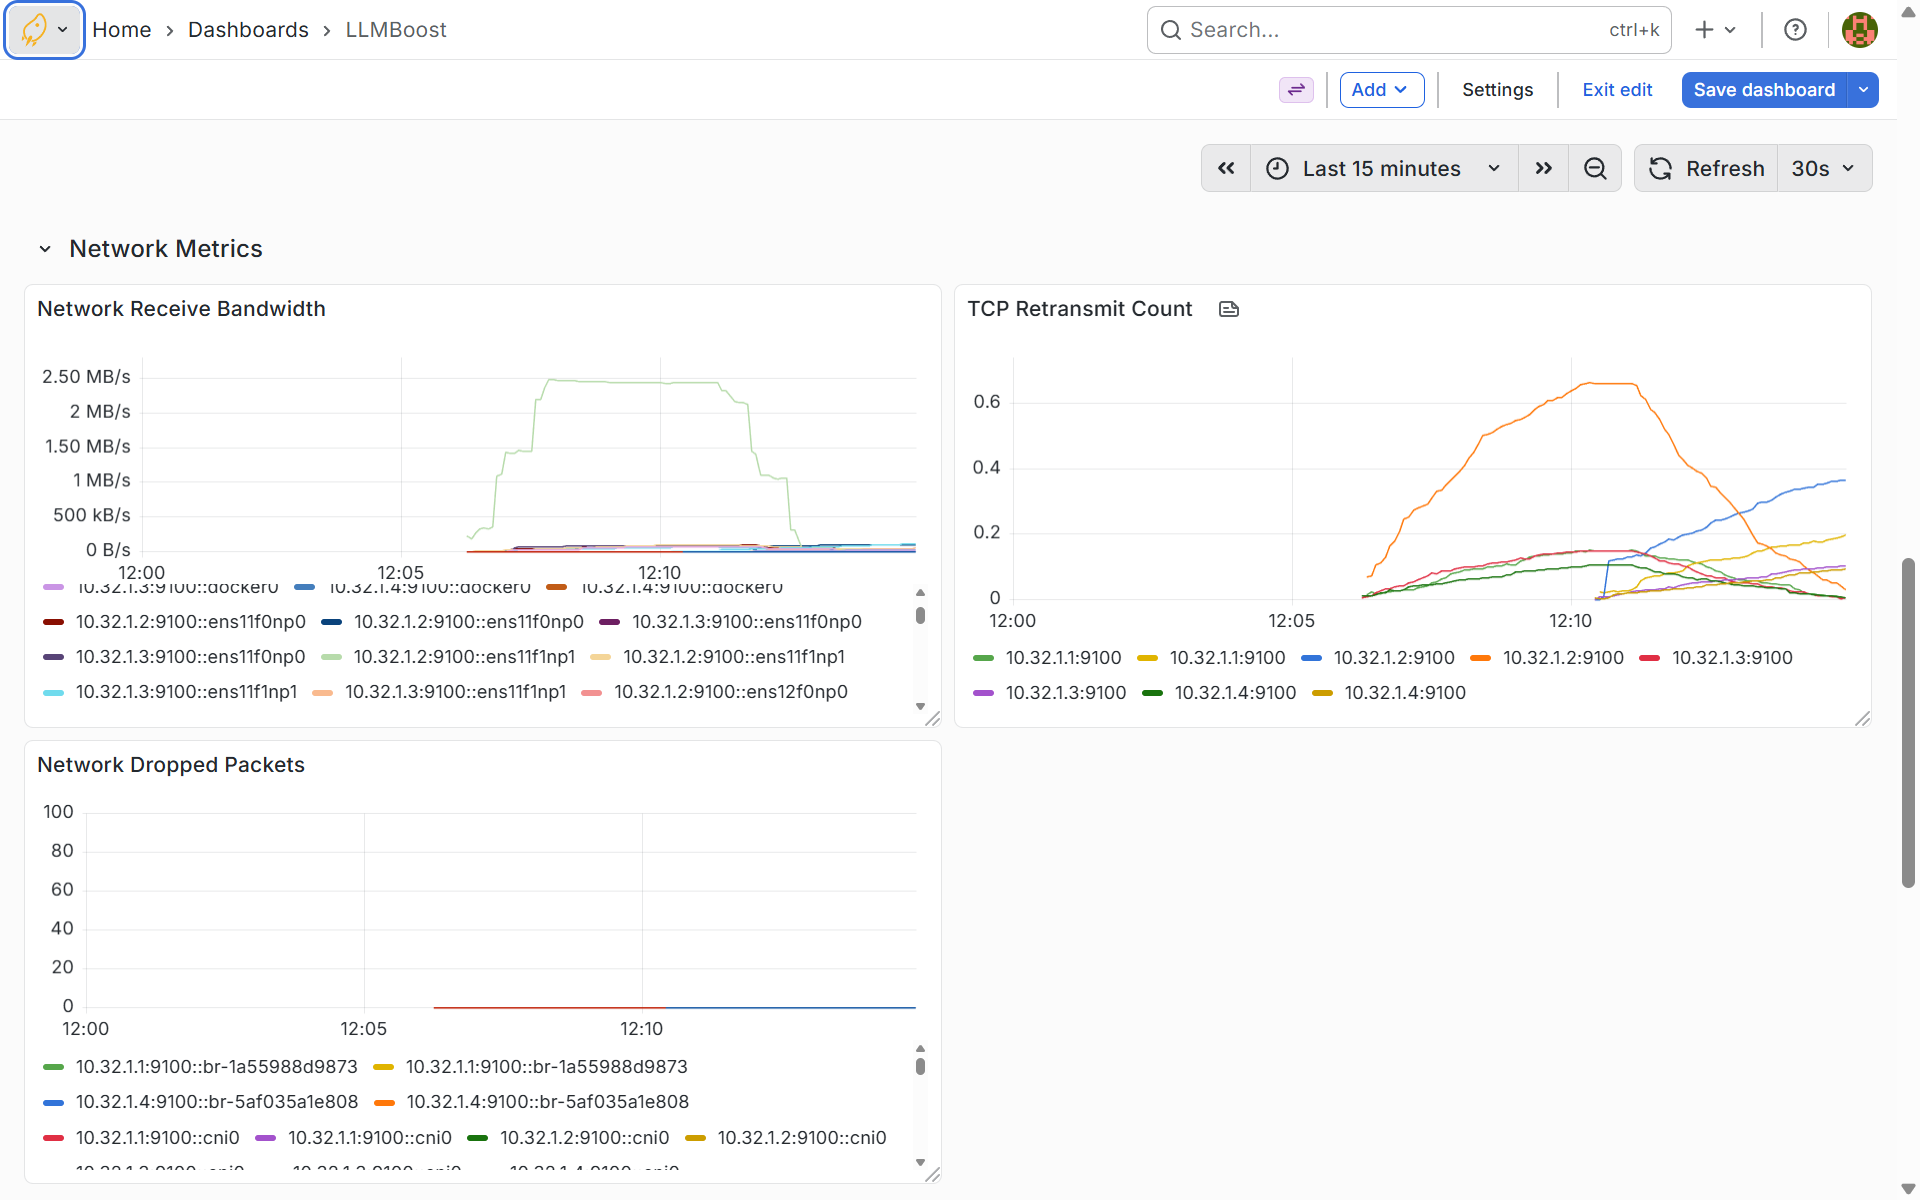
This dashboard monitors network health across your cluster, tracking receive bandwidth, TCP retransmit counts, and dropped packets per network interface. Network metrics help you identify connectivity issues, bandwidth saturation, or packet loss that could slow down distributed inference or cause request timeouts. High retransmit counts or dropped packets indicate network problems that should be investigated to maintain optimal multi-node communication.
Using the Inference Services
Accessing Individual Endpoints
Inference services on worker nodes listen for requests on port 30080. You can connect to individual nodes using the OpenAI-compatible API:
from openai import OpenAI

# Connect to a specific worker node
client = OpenAI(
    base_url="http://<worker-node-ip>:30080/api/v1",
    api_key="-"
)

response = client.chat.completions.create(
    model="meta-llama/Llama-3.1-8B-Instruct",
    messages=[
        {"role": "system", "content": "You are a helpful assistant."},
        {"role": "user", "content": "What is multi-node inference?"}
    ],
    stream=False
)

print(response.choices[0].message.content)
Load Balancing Across Multiple Nodes
For optimal performance, distribute requests across multiple worker nodes:
import threading
from queue import Queue
from openai import OpenAI

# Define prompts
prompts = [
    "How does multithreading work in Python?",
    "Write me a Fibonacci generator in Python",
    "Which pet should I get, dog or cat?",
    "How do I fine-tune an LLM model?"
]

# Thread worker for sending requests
def run_thread(host, queue: Queue):
    client = OpenAI(
        base_url=f"http://{host}/api/v1",
        api_key="-"
    )
    while not queue.empty():
        prompt = queue.get()
        chat_completion = client.chat.completions.create(
            model="meta-llama/Llama-3.1-8B-Instruct",
            messages=[
                {"role": "system", "content": "You are a helpful assistant."},
                {"role": "user", "content": prompt}
            ],
            stream=False
        )
        print(
            f"-------------------------------------------------------------------\n"
            f"Question: {prompt}\nAnswer: {chat_completion.choices[0].message.content}"
        )

# Worker node endpoints
hosts = ["10.4.16.1:30080", "10.4.16.2:30080"]

threads = []
queue = Queue()

# Populate the request queue
for prompt in prompts:
    queue.put(prompt)

# Launch threads for each host
for host in hosts:
    t = threading.Thread(target=run_thread, args=(host, queue))
    threads.append(t)
    t.start()

# Wait for all threads to complete
for thread in threads:
    thread.join()
Save this as client.py and run:
python client.py
Best Practices
Resource Planning
Estimate cluster requirements:
- Model size: Larger models need more GPUs per node
- Expected load: Higher concurrency requires more replicas
- GPU memory: Ensure nodes have sufficient VRAM per model
Deployment Strategy
Use node_replicas for:
- Homogeneous clusters with similar nodes
- Simple scaling without node-specific constraints
Use resource_selector for:
- Node-specific port assignments
- Explicit control over which nodes run which models
High Availability
Ensure redundancy:
- Deploy at least 3 replicas for production workloads
- Distribute replicas across availability zones
- Monitor pod health and automatic restarts
Troubleshooting
Pods Not Starting
Check pod status:
lbh cluster status
kubectl describe pod <pod-name> -n llmboost
Common issues:
- Insufficient GPU resources on nodes
- Image pull errors (check Docker credentials)
- Invalid Hugging Face token for private models
Out of Memory Errors
Solutions:
- Deploy to nodes with more GPUs: Select nodes with higher GPU capacity
- Reduce model size: Use smaller models or quantization
- Check node resources: Verify available GPU memory
# Check node GPU resources
kubectl describe nodes | grep -A 5 "Allocated resources"
Service Not Accessible
Verify service configuration:
kubectl get svc -n llmboost
kubectl get endpoints -n llmboost
Check:
- Service type (LoadBalancer, NodePort, ClusterIP)
- Firewall rules and network policies
- Ingress controller configuration
Deployment Not Reconciling
Check operator logs:
lbh cluster logs --management --pod operator
kubectl logs -n llmboost deployment/llmboost-operator
Verify:
- Operator is running:
kubectl get pods -n llmboost | grep operator - CRD is installed:
kubectl get crd llmboostdeployments.mangoboost.io
Next Steps
- Single-Node Multi-GPU - Optimize GPU utilization on single servers
- Streaming - Enable real-time token generation
- OpenAI API Compatible - Use standard API clients
Questions? Contact contact@mangoboost.io